
Abstract
Volatility spillovers and market network connectedness is the most recent phenomena which prevails among the financial markets. The purpose of this research is to evaluate the volatility spillovers and connectedness among Islamic Stock indices of global (MSCI) and Islamic indices of the regional stock markets i.e., DJMI, FTSE, JKI and KMI during the period 01/07/ 2013 to 30/06/2018. We used EGARCH (Nelson 1991), DCC-GARCH, static and rolling- window analysis to investigate the effects of volatility spillovers and connectedness by Diebold and Yilmaz (2012, 2014) and Mensi et al. (2018) methodology. It is concluded that MSCI and FTSE are the net recipients of shocks whereas; DJMI, JKI and KMI are net transmitters of shocks in a static spillover convention. Shock transmission process is time variant and volatility behaves in an asymmetric manner. The risk of spillover is quite sensitive to the political and economic events and it varies over time.
Key Words
Islamic Indices, EGARCH, DCC-GARCH, Volatility Spillover and Rolling Window Analysis
Introduction
International financial system has become more complicated as a result of ongoing structural changes comprising innovative financial products and technological improvements, which have affected the global financial architecture and economy of the world speedily. The volatility of stock returns has complicated properties of long memory, substantial outliers, regime change and volatility clustering. These properties have made the substantial importance of modern adoption of financial strategies regarding the co-movements and spillovers across the global and regional stock returns. This innovation has aroused from the last decade and the connectedness of cross-market has become very important subject matter in the investment market. Shocks affect the patterns of the equity market returns and volatility as well. In the recent history, Great Crisis (2007-2011) hit the financial system of the world forcefully which has started from the sub-prime mortgage market of U.S. and rolling through many stage lasting from one and half year that have affected the several stock markets of several countries and became a strong cause of a global trade contraction and global recession sharply in 2009. This element aroused within various European countries and such financial crisis created an unprecedented reaction in sense of fiscal and non- conventional monetary policies. Moreover, the lack of a crisis may mitigate the framework and consistent supra-national macro prudential leads to more uncertainty. This background clears the understanding of the financial crises and the evolution of financial crises strongly depends upon the understanding of the financial institution connectedness. Stock prices and its future contract must move simultaneously in a competitive market. This relationship can helpful to predict the prices of stock market in different countries that may enhance portfolio diversification. Emerging economies are endeavoring to become the developed and modern nations in true spirit, the key challenges that are faced by these economies is to resolve the problems of strong dependencies on mature economies for financial transactions. Attention has been accredited to evaluate the relationship among nature of the stock market spillover and uncertainty across countries. For this purpose many studies related to financial market connectedness and spillover effect have been have been performed to identify the significant levels. These studies have investigated the existence of co-movements but they reflect different results in different economies in different sub periods. However still there are number of unaddressed issues in various aspects of stock indices. The focus of this study is to test the volatility spillovers dynamics and network connectedness between Islamic Indices of Regional Stock Markets and do the risk spillover is sensitive to political and economic events and varies over time is the question of the day? Moreover, we are looking into the matter to explore that whether the risk spillover intensifies throughout the sample period. These elements are intensifying the large inferences in terms of downside risk and investment diversification for speculators and portfolio managers in developing the risk management portfolios and assets allocation. Global trade liberalization and market connectedness have provided the opportunity to the business parties and investors to make more rational and profitable investment opportunities across the globe and to use new Islamic financial instruments as innovative financial securitization element. First segment of this paper is a brief introduction of the spillovers and volatility and the second component follows the literature review. Third segment elaborates the methodology and fourth component expresses the results and discussion. Last segment of this empirical study has summarized the conclusion.
Literature Review
Diebold and Yilmaz (2009) analyzed the total and directional volatility spillovers by using the GVAR framework to check the daily volatility spillovers among the United States bond, foreign exchange, commodities and stock markets from January 1999 to January 2010. This study showed that during the sample period in all four markets regardless of significant volatility fluctuations, it is seen that cross market volatility spillovers were limited in 2007 due to global financial crisis. Diebold and Yilmaz (2012) have taken the sample of eleven countries from April 1999 to January 2014. For the evaluation of net directional volatility spillovers, they used a dynamic analysis to check that whether peripheral and core markets differences are present or not by applying panel data analysis to evaluate the net directional spillovers determinant as well. Wang (2016) examined the volatility spillover effect and causal relationship among two prices of CSI 300, one in stock market and one in futures market. He identified that different studies on different developed markets indicate that change in stock prices can be predicted by changes in futures prices. However, they (2016) analyzed connectedness of equity return volatility in the major European and American financial institutions network from 2004 to 2014 and also analysed the key aspects of the financial crisis evolution. They found that connectedness direction was clear from the US to Europe during 2007-2008 and in 2008 this connectedness became bidirectional and identified that some particular institutions had important roles in creating connectedness throughout the United States and European financial crises.
The methodology of Diebold and Yilmaz (2012) was again testified as Mensi et al. (2017) identified risk spillovers and time-varying equi-correlations among the gold, crude oil, and the Islamic stock index aggregates. The results of their study revealed that gold offers downside risk reductions and better portfolio diversification benefits than oil. McDonald et al. (2018) studied the potential spillover and cross-co variances effects among the Eurozone financial markets and economies. They employed the financial stress indexes, as a systemic risk metrics. They also completed an empirical finding both between zero to “n” numbers” and “within” Eurozone markets and economies. The findings of this study show a lot of interesting points on country level. The volatility transmission channel is very strong from the heavily hit, from the crisis and economies towards the rest. The role and importance of this transmission from the bond markets and banking is underlined additionally. Opposing to common perception, Greece is not the main transmitter of uncertainty of volatility, but it is among the important receivers of the volatility risk while the importance of money market is also in the “between” empirical approach. Further Dynamic connectedness is tested by Manopimikea (2018) between Asian emerging markets and other international markets. He concluded that international equity markets are integrated tightly. Mensi et al. (2018) investigated the regional stock markets of USA, GIPSI economies and the Global Stock market to analyze the volatility spillovers and market connectedness. They used the methodology of Diebold and Yilmaz (2012, 2014) to conduct a static as well as analysis through rolling-window method to measure the volatility spillovers. They investigated this element at different levels of present crises. Financial contagion effect has been supported the topical intensified crises that has created the strong volatility spillovers across the markets. Moreover, it is identified that the global stock market, regional markets of USA and the stock markets of Italy, Portugal, and Ireland are the net transmitters of the shocks. However, the stock markets of Greece and Spain are identified as net receiver of the shocks. The results of Ahmad et al. (2013) show that GIPSI countries, Italy Spain and Ireland seem to be more contagious for BRIICS markets as compared to the Greece. This research shows that India, Russia, Brazil, South Africa and China are strongly affected by the contagion shock during the period of Eurozone Crisis. However, South Korea and Indonesia report not contagion and interdependence.
Data and Methodology
The daily returns of five Islamic indices have been taken to identify the volatility spillovers dynamics and network connectedness between Islamic indices. Jakarata Islamic index, Dow Jones Islamic index, MSCI Global Islamic index, KSE Meezan Islamic Index and FTSE Islamic index have been taken to identify the volatility spillovers and network connectedness. The closing price data of Islamic index have been taken from investing.com for the period July 1, 2013 to June 30, 2018. Efficient market theory describes that the stock market responds to new information very quickly, so the market prices consist of sum of all investors’ views of stock market at any given time. This theory does not explain that the market is correct always. It explains that the market provides the sum of available information and choices made by investors and traders. Investors and traders can be wrong and information can be wrong. When the stock market is wrong temporarily then best opportunities come. The smart traders of stock markets will find the dissimilarity among the ideal value and the stock market value of a stock earlier than the rest of the crowd does. In this research we employed the EGARCH model Neslon (1991), in first essence which shows that Leverage effects are also captured as well as the impact of news. In the model the conditional variance is given by:
Log?_t^2 = ?_0+ ? log ?_(t-1)^2+ ?_1 |?_(t-1)/?_(t-1) | + ? ( ?_(t-1))/?_(t-1) (1)
EGARCH model elaborates the concept of positivity of the parameters because it works in the sense of log of the variance. The value of ? indicates the leverage effect but the leverage effect presence is shown only if ? value is negative and significant. We also used the ENGLE ADCC GARCH model. Moreover we used the Diebold and Yilmaz (2014, 2016) variance decomposition matrix and generalized vector auto regression (GVAR) is used to identify directional connectedness among the Islamic indices. The covariance stationary VAR (p) is supposed as followed.
a_t = ?_(i-1)^p??b_i a_(t-i)+? ?_t (2)
Where:
a_t = n x 1vector of endogenous variable
b_i = n x n autoregressive coefficient matrix
?_t = vector of error terms which is supposed to be uncorrelated serially
(GVAR) model is used to elaborate H-step as follow.
Ô_ij(H) = (?_jj^(-1) ?_(h=0)^(H-1) (?_i^? A_h ????_i )^2)/(?_(h=0)^(H-1) (?_i^? A_h ??A?_(h ) ?_i )^2 ) (3)
Where:
? = vector of errors ? variance matrix
?_jj = error term standard deviation of the jth equation
?_i = n x 1 vector along with 1 on the ith element and other wise zero
Every entry is treated as normal in the matrix of variance decomposition, as follows:
Ô_ij(H) = (Ô_ij (H) )/(?_(j=1 )^n Ô_ij (H) ) (4)
with ?_(j=1 )^n Ô_ij (H) = by construction and the pairwise directional connectedness is provided by the equation ?_(j=1 )^n Ô_ij (H) = 1. Ô_ij (H) which is from "j" to "i" at H horizon. However, pairwise connectedness ?_(i?j) (H) and the opposite direction ?_(j?i) (H) is calculated as to identify the transmission.
?_ij= ?_(i?j) (H)- ?_(j?i) (H) (5)
The information transmission among two markets is identified through this index. We aggregated the “total directional connectedness” partially to understand that how the financial markets contribute to only one market in a joint formation. “From” and “to” are the two different versions to reflect the total directional connectedness as i is? ??_(i? ?) (H) from al markets to the i market which is calculated as:
? ??_(i? ?) (H)= (?_(j=1 ,j?i)^N Ô_ij (H))/(?_(i ,j=1 )^N Ô_ij (H)) ×100 = (?_(j=1 ,j?i)^N Ô_ij (H))/N ×100 (6)
In what manner a market i contribute to all other markets shocks? We calculated this contribution with partial aggregation similarly. The notation of “total directional connectedness” from all the markets to market i is? ??_( ? ? i) (H), which is calculated as:
? ??_( ? ? i) (H)= (?_(j=1 ,j?i)^N Ô_ij (H))/(?_(i ,j=1 )^N Ô_ij (H)) ×100 = (?_(j=1 ,j?i)^N Ô_ij (H))/N ×100 (7)
To elaborate net total directional connectedness the two pair wise directional indices is combined as followed.
? ??_i ?(H)?^?= ?_( ? ? i) (H)- ?_(i? ?) (H) (8)
Across all markets the total aggregation of variance decomposition computes the total connectedness index. We calculated the total connectedness of all markets as:
?(H) = (?_(i ,j=1 ,i?j)^N Ô_ij (H))/(?_(i ,j=1 )^N Ô_ij (H)) ×100 = (?_(i ,j=1 ,i?j)^N Ô_ij (H))/N ×100 (9)
Further for variance decomposition test we used net pair wise directional connectedness as expressed in Equation 8 and 9
Results and Discussion
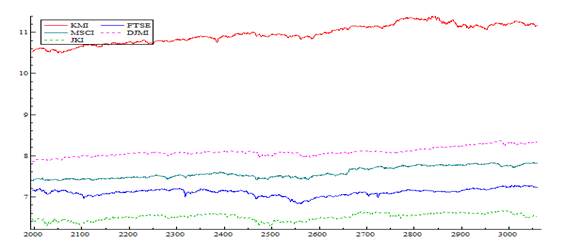
Fig1 indicates the trend of daily closing prices of five Islamic indices. Price behavior reflects rising trend. 
Figure 1: Trend of Islamic Stock Indices of MSCI, DJMI, FTSE, JKI, KMI
Results of Table 1 indicate descriptive statistics for the behavior of returns during the period July 1, 2013 to June 30, 2018. The average returns of all indices are positive. FTSE, JKI and KMI Islamic indices are more volatile than MSCI and DJMI. Skewness, Kurtosis and Jarque –Bera test results show that all returns are deviating minor from Gaussian distribution. However data reflects normal behavior.
Table 1. Summary Descriptive Statistics align="center">
| width="17%" nowrap="" valign="bottom"> MSCI width="17%" nowrap="" valign="bottom">DJMI width="16%" nowrap="" valign="bottom">FTSE width="15%" nowrap="" valign="bottom">JKI width="16%" nowrap="" valign="bottom">KMI | > Mean width="17%" nowrap="" valign="bottom">0.000393 width="17%" nowrap="" valign="bottom">0.000437 width="16%" nowrap="" valign="bottom">0.000059 width="15%" nowrap="" valign="bottom">0.000056 width="16%" nowrap="" valign="bottom">0.000602 | > Median width="17%" nowrap="" valign="bottom">0.000673 width="17%" nowrap="" valign="bottom">0.000696 width="16%" nowrap="" valign="bottom">0.000656 width="15%" nowrap="" valign="bottom">0.000679 width="16%" nowrap="" valign="bottom">0.000908 | > Maximum width="17%" nowrap="" valign="bottom">0.044613 width="17%" nowrap="" valign="bottom">0.039632 width="16%" nowrap="" valign="bottom">0.038272 width="15%" nowrap="" valign="bottom">0.056382 width="16%" nowrap="" valign="bottom">0.047769 | > Minimum width="17%" nowrap="" valign="bottom">0.039669 width="17%" nowrap="" valign="bottom">-0.064437 width="16%" nowrap="" valign="bottom">-0.103512 width="15%" nowrap="" valign="bottom">-0.077044 width="16%" nowrap="" valign="bottom">-0.069917 | > Std. Dev. width="17%" nowrap="" valign="bottom">0.009002 width="17%" nowrap="" valign="bottom">0.007687 width="16%" nowrap="" valign="bottom">0.010681 width="15%" nowrap="" valign="bottom">0.012858 width="16%" nowrap="" valign="bottom">0.012239 | > Skewness width="17%" nowrap="" valign="bottom">0.152299 width="17%" nowrap="" valign="bottom">-0.970681 width="16%" nowrap="" valign="bottom">-1.506318 width="15%" nowrap="" valign="bottom">-0.416048 width="16%" nowrap="" valign="bottom">-0.360694 | > Kurtosis width="17%" nowrap="" valign="bottom">5.176204 width="17%" nowrap="" valign="bottom">11.6685 width="16%" nowrap="" valign="bottom">14.50432 width="15%" nowrap="" valign="bottom">6.412529 width="16%" nowrap="" valign="bottom">6.252789 | > Jarque-Bera width="17%" nowrap="" valign="bottom">213.8687* width="17%" nowrap="" valign="bottom">3495.131* width="16%" nowrap="" valign="bottom">6263.965* width="15%" nowrap="" valign="bottom">546.4589* width="16%" nowrap="" valign="bottom">491.6835* | > Probability width="17%" nowrap="" valign="bottom">0 width="17%" nowrap="" valign="bottom">0 width="16%" nowrap="" valign="bottom">0 width="15%" nowrap="" valign="bottom">0 width="16%" nowrap="" valign="bottom">0 | > Sum width="17%" nowrap="" valign="bottom">0.417964 width="17%" nowrap="" valign="bottom">0.464036 width="16%" nowrap="" valign="bottom">0.063126 width="15%" nowrap="" valign="bottom">0.060315 width="16%" nowrap="" valign="bottom">0.639543 | > Sum Sq. Dev. width="17%" nowrap="" valign="bottom">0.086066 width="17%" nowrap="" valign="bottom">0.062758 width="16%" nowrap="" valign="bottom">0.121158 width="15%" nowrap="" valign="bottom">0.175591 width="16%" nowrap="" valign="bottom">0.159093 | > Observations width="17%" nowrap="" valign="bottom">1063 width="17%" nowrap="" valign="bottom">1063 width="16%" nowrap="" valign="bottom">1063 width="15%" nowrap="" valign="bottom">1063 width="16%" nowrap="" valign="bottom">1063 |
width="15%" valign="bottom">
At Level
width="11%" valign="bottom">DJMI
width="11%" valign="bottom">FTSE
width="11%" valign="bottom">JKI
width="11%" valign="bottom">KMI
width="11%" valign="bottom">MSCI
With Const.
width="15%" valign="bottom">t-Stat
width="11%" valign="bottom">-0.9883
width="11%" valign="bottom">-2.1716
width="11%" valign="bottom">-2.4698
width="11%" valign="bottom">-1.5031
width="11%" valign="bottom">-0.6322
width="15%" valign="bottom">
Probability.
width="11%" valign="bottom">0.7592
width="11%" valign="bottom">0.2170
width="11%" valign="bottom">0.1232
width="11%" valign="bottom">0.5319
width="11%" valign="bottom">0.8608
width="15%" valign="bottom">
width="11%" valign="bottom">
No
width="11%" valign="bottom">No
width="11%" valign="bottom">no
width="11%" valign="bottom">no
width="11%" valign="bottom">no
With Const. and Trend
width="15%" valign="bottom">t-Stat
width="11%" valign="bottom">-2.3289
width="11%" valign="bottom">-2.4781
width="11%" valign="bottom">-3.0454
width="11%" valign="bottom">-2.4704
width="11%" valign="bottom">-2.4807
width="15%" valign="bottom">
Probability.
width="11%" valign="bottom">0.4173
width="11%" valign="bottom">0.3390
width="11%" valign="bottom">0.1204
width="11%" valign="bottom">0.3429
width="11%" valign="bottom">0.3378
width="15%" valign="bottom">
width="11%" valign="bottom">
No
width="11%" valign="bottom">No
width="11%" valign="bottom">no
width="11%" valign="bottom">no
width="11%" valign="bottom">no
Without Const. and Trend
width="15%" valign="bottom">t-Stat
width="11%" valign="bottom">1.4860
width="11%" valign="bottom">0.0162
width="11%" valign="bottom">-0.0568
width="11%" valign="bottom">0.7686
width="11%" valign="bottom">1.3590
width="15%" valign="bottom">
Probability.
width="11%" valign="bottom">0.9664
width="11%" valign="bottom">0.6877
width="11%" valign="bottom">0.6637
width="11%" valign="bottom">0.8795
width="11%" valign="bottom">0.9567
width="15%" valign="bottom">
width="11%" valign="bottom">
No
width="11%" valign="bottom">No
width="11%" valign="bottom">no
width="11%" valign="bottom">no
width="11%" valign="bottom">no
width="26%" colspan="2" valign="bottom">
At 1st Difference
width="11%" valign="bottom">width="11%" valign="bottom">
width="11%" valign="bottom">
width="11%" valign="bottom">
width="15%" valign="bottom">
width="11%" valign="bottom">
d(DJMI)
width="11%" valign="bottom">d(FTSE)
width="11%" valign="bottom">d(JKI)
width="11%" valign="bottom">d(KMI)
width="11%" valign="bottom">d(MSCI)
With Const.
width="15%" valign="bottom">t-Stat
width="11%" valign="bottom">-27.9251
width="11%" valign="bottom">-28.1305
width="11%" valign="bottom">-32.8186
width="11%" valign="bottom">-28.4051
width="11%" valign="bottom">-33.8167
width="15%" valign="bottom">
Probability.
width="11%" valign="bottom">0.0000
width="11%" valign="bottom">0.0000
width="11%" valign="bottom">0.0000
width="11%" valign="bottom">0.0000
width="11%" valign="bottom">0.0000
width="15%" valign="bottom">
width="11%" valign="bottom">
***
width="11%" valign="bottom">***
width="11%" valign="bottom">***
width="11%" valign="bottom">***
width="11%" valign="bottom">***
With Const. and Trend
width="15%" valign="bottom">t-Stat
width="11%" valign="bottom">-27.9139
width="11%" valign="bottom">-28.1338
width="11%" valign="bottom">-32.8061
width="11%" valign="bottom">-28.4025
width="11%" valign="bottom">-33.8057
width="15%" valign="bottom">
Probability.
width="11%" valign="bottom">0.0000
width="11%" valign="bottom">0.0000
width="11%" valign="bottom">0.0000
width="11%" valign="bottom">0.0000
width="11%" valign="bottom">0.0000
width="15%" valign="bottom">
width="11%" valign="bottom">
***
width="11%" valign="bottom">***
width="11%" valign="bottom">***
width="11%" valign="bottom">***
width="11%" valign="bottom">***
Without Const. and Trend
width="15%" valign="bottom">t-Stat
width="11%" valign="bottom">-27.8580
width="11%" valign="bottom">-28.1426
width="11%" valign="bottom">-32.8326
width="11%" valign="bottom">-28.3790
width="11%" valign="bottom">-33.7584
width="15%" valign="bottom">
Probability.
width="11%" valign="bottom">0.0000
width="11%" valign="bottom">0.0000
width="11%" valign="bottom">0.0000
width="11%" valign="bottom">0.0000
width="11%" valign="bottom">0.0000
width="15%" valign="bottom">
width="11%" valign="bottom">
***
width="11%" valign="bottom">***
width="11%" valign="bottom">***
width="11%" valign="bottom">***
width="11%" valign="bottom">***
Notes:
width="11%" valign="bottom">width="11%" valign="bottom">
width="11%" valign="bottom">
width="11%" valign="bottom">
width="11%" valign="bottom">
· *Significant at p< 0.10>· **Significant at p<0.05 >· *** Significant at the 1%>· (no) Not Significant
The lag length is based on SIC
width="11%" valign="bottom">width="11%" valign="bottom">
width="11%" valign="bottom">
width="11%" valign="bottom">
Mean Equation
Parameters
width="86" nowrap="" valign="bottom">DJMI
width="86" nowrap="" valign="bottom">FTSE
width="86" nowrap="" valign="bottom">JKI
width="97" nowrap="" colspan="2" valign="bottom">KMI
width="93" nowrap="" colspan="2" valign="bottom">MSCI
?
width="86" nowrap="" valign="bottom">0.0003
width="86" nowrap="" valign="bottom">-0.0002
width="86" nowrap="" valign="bottom">-0.0001
width="97" nowrap="" colspan="2" valign="bottom">0.0003
width="93" nowrap="" colspan="2" valign="bottom">0.0002
p-value
width="86" nowrap="" valign="bottom">0.0909
width="86" nowrap="" valign="bottom">0.4765
width="86" nowrap="" valign="bottom">0.7705
width="97" nowrap="" colspan="2" valign="bottom">0.3586
width="93" nowrap="" colspan="2" valign="bottom">0.4243
?
width="86" nowrap="" valign="bottom">0.1655
width="86" nowrap="" valign="bottom">0.1522
width="86" nowrap="" valign="bottom">-0.0287
width="97" nowrap="" colspan="2" valign="bottom">0.1654
width="93" nowrap="" colspan="2" valign="bottom">-0.0524
p-value
width="86" nowrap="" valign="bottom">0.0000
width="86" nowrap="" valign="bottom">0.0000
width="86" nowrap="" valign="bottom">0.3542
width="97" nowrap="" colspan="2" valign="bottom">0.0000
width="93" nowrap="" colspan="2" valign="bottom">0.1309
Significant at p<0.01
width="86" nowrap="" valign="bottom"> width="86" nowrap="" valign="bottom"> width="97" nowrap="" colspan="2" valign="bottom"> width="93" nowrap="" colspan="2" valign="bottom">>
Variance Equation
Parameters
width="86" nowrap="" valign="bottom">DJMI
width="86" nowrap="" valign="bottom">FTSE
width="86" nowrap="" valign="bottom">JKI
width="97" nowrap="" colspan="2" valign="bottom">KMI
width="93" nowrap="" colspan="2" valign="bottom">MSCI
width="86" nowrap="" valign="bottom">
-0.6021
width="86" nowrap="" valign="bottom">-0.5404
width="86" nowrap="" valign="bottom">-0.1279
width="97" nowrap="" colspan="2" valign="bottom">-0.8529
width="93" nowrap="" colspan="2" valign="bottom">-0.9223
p-value
width="86" nowrap="" valign="bottom">0.0000
width="86" nowrap="" valign="bottom">0.0000
width="86" nowrap="" valign="bottom">0.0000
width="97" nowrap="" colspan="2" valign="bottom">0.0000
width="93" nowrap="" colspan="2" valign="bottom">0.0000
?
width="86" nowrap="" valign="bottom">0.1496
width="86" nowrap="" valign="bottom">0.2012
width="86" nowrap="" valign="bottom">0.0423
width="97" nowrap="" colspan="2" valign="bottom">0.1290
width="93" nowrap="" colspan="2" valign="bottom">0.2191
p-value
width="86" nowrap="" valign="bottom">0.0000
width="86" nowrap="" valign="bottom">0.0000
width="86" nowrap="" valign="bottom">0.0002
width="97" nowrap="" colspan="2" valign="bottom">0.0000
width="93" nowrap="" colspan="2" valign="bottom">0.0000
width="86" nowrap="" valign="bottom">
-0.1751
width="86" nowrap="" valign="bottom">-0.1353
width="86" nowrap="" valign="bottom">-0.0660
width="97" nowrap="" colspan="2" valign="bottom">-0.1861
width="93" nowrap="" colspan="2" valign="bottom">-0.0730
p-value
width="86" nowrap="" valign="bottom">0.0000
width="86" nowrap="" valign="bottom">0.0000
width="86" nowrap="" valign="bottom">0.0000
width="97" nowrap="" colspan="2" valign="bottom">0.0000
width="93" nowrap="" colspan="2" valign="bottom">0.0000
?
width="86" nowrap="" valign="bottom">0.9512
width="86" nowrap="" valign="bottom">0.9581
width="86" nowrap="" valign="bottom">0.9892
width="97" nowrap="" colspan="2" valign="bottom">0.9153
width="93" nowrap="" colspan="2" valign="bottom">0.9204
p-value
width="86" nowrap="" valign="bottom">0.0000
width="86" nowrap="" valign="bottom">0.0000
width="86" nowrap="" valign="bottom">0.0000
width="97" nowrap="" colspan="2" valign="bottom">0.0000
width="93" nowrap="" colspan="2" valign="bottom">0.0000
Summery Statistics
DJMI
width="66" nowrap="" valign="bottom">FTSE
width="59" nowrap="" valign="bottom">JKI
width="73" nowrap="" valign="bottom">KMI
width="160" nowrap="" valign="bottom">MSCI
Adjusted >R-squared
width="65" nowrap="" valign="bottom">0.0229
width="66" nowrap="" valign="bottom">0.0212
width="59" nowrap="" valign="bottom">-0.0021
width="73" nowrap="" valign="bottom">0.0169
width="160" nowrap="" valign="bottom">-0.0016
Durbin-Watson Test
width="65" nowrap="" valign="bottom">2.0121
width="66" nowrap="" valign="bottom">1.9772
width="59" nowrap="" valign="bottom">1.9444
width="73" nowrap="" valign="bottom">2.0398
width="160" nowrap="" valign="bottom">1.9335
Diagnostic Test
DJMI
width="64" nowrap="" valign="bottom">FTSE
width="63" nowrap="" valign="bottom">JKI
width="67" nowrap="" valign="bottom">KMI
width="173" nowrap="" valign="bottom">MSCI
AIC
width="65" nowrap="" valign="bottom">-7.2413
width="64" nowrap="" valign="bottom">-6.5471
width="63" nowrap="" valign="bottom">-6.0137
width="67" nowrap="" valign="bottom">-6.1296
width="173" nowrap="" valign="bottom">-6.6621
SIC
width="65" nowrap="" valign="bottom">-7.2132
width="64" nowrap="" valign="bottom">-6.5191
width="63" nowrap="" valign="bottom">-5.9856
width="67" nowrap="" valign="bottom">-6.1015
width="173" nowrap="" valign="bottom">-6.6340
H-Q C
width="65" nowrap="" valign="bottom">-7.2307
width="64" nowrap="" valign="bottom">-6.5365
width="63" nowrap="" valign="bottom">-6.0030
width="67" nowrap="" valign="bottom">-6.1190
width="173" nowrap="" valign="bottom">-6.6515
| width="64" nowrap="" colspan="2" valign="top"> MSCI width="64" nowrap="" colspan="2" valign="top">DJMI width="68" nowrap="" colspan="2" valign="top">FTSE width="58" nowrap="" colspan="3" valign="top">JKI width="68" nowrap="" colspan="2" valign="top">KMI width="89" nowrap="" valign="top">From >
| > MSCI width="64" nowrap="" colspan="2" valign="top">93.9 width="64" nowrap="" colspan="2" valign="top">1.3 width="68" nowrap="" colspan="2" valign="top">2.6 width="58" nowrap="" colspan="3" valign="top">1.4 width="68" nowrap="" colspan="2" valign="top">0.8 width="89" nowrap="" valign="top">6.1 >
| > DJMI width="64" nowrap="" colspan="2" valign="top">9.5 width="64" nowrap="" colspan="2" valign="top">86.5 width="68" nowrap="" colspan="2" valign="top">0.9 width="58" nowrap="" colspan="3" valign="top">2.3 width="68" nowrap="" colspan="2" valign="top">0.7 width="89" nowrap="" valign="top">13.5 >
| > FTSE width="64" nowrap="" colspan="2" valign="top">4.2 width="64" nowrap="" colspan="2" valign="top">0.8 width="68" nowrap="" colspan="2" valign="top">94 width="58" nowrap="" colspan="3" valign="top">0.5 width="68" nowrap="" colspan="2" valign="top">0.5 width="89" nowrap="" valign="top">6 >
| > JKI width="64" nowrap="" colspan="2" valign="top">3.6 width="64" nowrap="" colspan="2" valign="top">4.6 width="68" nowrap="" colspan="2" valign="top">2.5 width="58" nowrap="" colspan="3" valign="top">88 width="68" nowrap="" colspan="2" valign="top">1.4 width="89" nowrap="" valign="top">12 >
| > KMI width="64" nowrap="" colspan="2" valign="top">1.8 width="64" nowrap="" colspan="2" valign="top">0.6 width="68" nowrap="" colspan="2" valign="top">2.1 width="58" nowrap="" colspan="3" valign="top">0.3 width="68" nowrap="" colspan="2" valign="top">95.1 width="89" nowrap="" valign="top">4.9 >
| > To width="64" nowrap="" colspan="2" valign="top">19.1 width="64" nowrap="" colspan="2" valign="top">7.3 width="68" nowrap="" colspan="2" valign="top">8.1 width="58" nowrap="" colspan="3" valign="top">4.6 width="68" nowrap="" colspan="2" valign="top">3.4 width="89" nowrap="" valign="top">42.5 >
| > All width="64" nowrap="" colspan="2" valign="top">113 width="64" nowrap="" colspan="2" valign="top">93.8 width="68" nowrap="" colspan="2" valign="top">102.1 width="58" nowrap="" colspan="3" valign="top">92.5 width="68" nowrap="" colspan="2" valign="top">98.5 width="89" nowrap="" valign="top">8.50% >
| > width="93" nowrap="" colspan="2" valign="top"> MSCI width="47" nowrap="" colspan="2" valign="top">DJMI width="50" nowrap="" colspan="2" valign="top">FTSE width="51" nowrap="" colspan="2" valign="top">JKI width="48" nowrap="" valign="top">KMI width="59" nowrap="" colspan="2" valign="top">Net width="126" nowrap="" colspan="3" valign="top">Conclusions | > MSCI width="93" nowrap="" colspan="2" valign="top">0 width="47" nowrap="" colspan="2" valign="top">-8.2 width="50" nowrap="" colspan="2" valign="top">-1.6 width="51" nowrap="" colspan="2" valign="top">-2.2 width="48" nowrap="" valign="top">-1 width="59" nowrap="" colspan="2" valign="top">-13 width="126" nowrap="" colspan="3" valign="top">Net-Recipient | > DJMI width="93" nowrap="" colspan="2" valign="top">8.2 width="47" nowrap="" colspan="2" valign="top">0 width="50" nowrap="" colspan="2" valign="top">0.1 width="51" nowrap="" colspan="2" valign="top">-2.3 width="48" nowrap="" valign="top">0.1 width="59" nowrap="" colspan="2" valign="top">6.1 width="126" nowrap="" colspan="3" valign="top">Net-Transmitter | > FTSE width="93" nowrap="" colspan="2" valign="top">1.6 width="47" nowrap="" colspan="2" valign="top">-0.1 width="50" nowrap="" colspan="2" valign="top">0 width="51" nowrap="" colspan="2" valign="top">-2 width="48" nowrap="" valign="top">-1.6 width="59" nowrap="" colspan="2" valign="top">-2.1 width="126" nowrap="" colspan="3" valign="top">Net-Recipient | > JKI width="93" nowrap="" colspan="2" valign="top">2.2 width="47" nowrap="" colspan="2" valign="top">2.3 width="50" nowrap="" colspan="2" valign="top">2 width="51" nowrap="" colspan="2" valign="top">0 width="48" nowrap="" valign="top">1.1 width="59" nowrap="" colspan="2" valign="top">7.6 width="126" nowrap="" colspan="3" valign="top">Net-Transmitter | > KMI width="93" nowrap="" colspan="2" valign="top">1 width="47" nowrap="" colspan="2" valign="top">-0.1 width="50" nowrap="" colspan="2" valign="top">1.6 width="51" nowrap="" colspan="2" valign="top">-1.1 width="48" nowrap="" valign="top">0 width="59" nowrap="" colspan="2" valign="top">1.4 width="126" nowrap="" colspan="3" valign="top">Net-Transmitter | height="0"> width="36"> width="57"> width="7"> width="39"> width="25"> width="25"> width="43"> width="8"> width="48"> width="2"> width="58"> width="11"> width="89"> width="26"> | ||||||||
Figure 2
Spill Over Index for Sub Periods
 For each Islamic indices stock market, Figure 2 shows the dynamic growth of net volatility spillover index. An inspection of Figure 3 indicates MSCI and FTSE are net receivers of the volatility shocks and JKI is a net transmitter of shocks to other markets with significant impact.
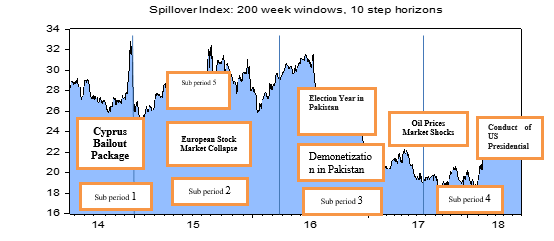
Figure 3
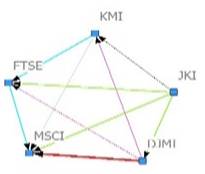
Net-Pairwise Directional Connectedness

Figure 3 indicates the net-pairwise directional connectedness of the considered Islamic indices stock markets. There are five nodes in this figure. Each node shows a single Islamic index stock market. The arrow line color shows connectedness among considered Islamic indices stock market. The red color of arrow line shows the strongest net pairwise connectedness and the green color of arrow line shows the weakest net pairwise connectedness among the considered Islamic indices stock market. Figure 3 indicates the connectedness of network in a directional manner for five sub-periods for gaining a full view of spillover risk among the said market.
A deep inside of Figure 3 indicates that DJMI and JKI Islamic indices are the net transmitters of shocks. However, the other Islamic indices are net receivers of the shocks. It is inferred from the results that the degree of this contribution differs across all the sub periods.
Conclusion
Results conclude that asymmetric behavior of the returns is reflected by the estimates of the EGARCH (1, 1). However the results of the ADCC-GARCH model show the asymmetric conditional correlations between the considered five Islamic market returns. Moreover, this study also found the significant risk spillovers between the Islamic indices. Further this study indicated that MSCI and FTSE Islamic indices are found net receivers of volatility shocks from the other indices. It is because both of these two markets have the capacity to behave with the inward information. JKI Islamic index is identified as net transmitter of volatility shock. Moreover, it has also enormous impact on other Islamic indices as well. The behavior regarding to net volatility spillovers may rupture in positive or in a negative direction for selected Islamic indexed markets. The risk spillover impact is sensitive to political and economic events and varies over time. Furthermore, we also concluded that the risk spillovers have intensified the impact throughout the sample period on the selected Islamic indices. These intensifications have large inferences in terms of downside risk and investment diversification for speculators and portfolio managers in developing the risk managed portfolios and assets allocation. Our results are in line with the results of Diebold and Yilmaz (2012, 2014, 2016) and Mensi et al (2018), However There is a need of revision of macroeconomic fundamentals and financial reforms regarding the Islamic financial system and composition of Islamic indices to stabilities the mechanism for the purposes in such a manner which can absorb the shock and volatility spillover to reduce the investors’ risk in managing the portfolios. However the network connectedness regarding to the transmission and net receiving of the volatility shocks may provide a guiding instrument to the policymakers in identification and evaluation of economic and trade policies.
Figure 1
References
- Adams, M., Andersson, J., Andersson, L.F. & Lindmark, M. (2009). Commercial banking, insurance and economic growth in Sweden between 1830 and 1998. Accounting, Business & Financial History, 19, 21-38.
- Ahmad, W., Sehgal, S., & Bhanumurthy, N. R. (2013). Eurozone crisis and BRIICS stock markets: contagion or market interdependence?Economic Modelling,33, 209-225.
- Diebold, F. X. and K. Yilmaz (2009). Measuring financial asset return and volatility spillovers.
- Diebold, F. X., & Yilmaz, K. (2012). Better togive than to receive: Predictive directional measurement of volatility spillovers.International Journal of Forecasting,28(1), 57-66
- Diebold, F. X., & Yilmaz, K. (2016). Trans-Atlantic equity volatility connectedness: US and European financial institutions, 2004-2014.Journal of Financial Econometrics,14(1), 81-127.
- Diebold, F.X. and Yilmaz, K. (2014). On the Network Topology of Variance Decompositions: Measuring the Connectedness of Financial Firms.Journal of Econometrics, 182, 119-134
- Fernández-RodrÃÂguez, F., Gómez-Puig, M., & Sosvilla-Rivero, S. (2015). Volatility spillovers in EMU sovereign bond markets.International Review of Economics & Finance,39, 337-352.
- MacDonald, R., Sogiakas, V., & Tsopanakis, A. (2018). Volatility co-movements and spillover effects within the Eurozone economies: A multivariate GARCH approach using the financial stress index.Journal of International Financial Markets, Institutions and Money,52, 17-36
- Manopimoke, P., Prukumpai, S., & Sethapramote, Y. (2018). Dynamic Connectedness in Emerging Asian Equity Markets. InBanking and Finance Issues in Emerging Markets(pp. 51-84). Emerald Publishing Limited
- Mensi, W., Boubaker, F. Z., Al-Yahyaee, K. H., & Kang, S. H. (2018). Dynamic volatility spillovers and connectedness between global, regional, and GIPSI stock markets.Finance Research Letters,25, 230-238
- Mensi, W., Hammoudeh, S., Al-Jarrah, I. M. W., Sensoy, A., & Kang, S. H. (2017). Dynamic risk spillovers between gold, oil prices and conventional, sustainability and Islamic equity aggregates and sectors with portfolio implications.Energy Economics,67, 454-475
- Nelson, D. B. (1991). Conditional heteroskedasticity in asset returns: A new approach.Econometrica: Journal of the Econometric Society, 347-370.
- Wang. L., 2016. Causal Relationship and Volatility Spillover between Chinese CSI 300 Index and Index Futures. Economics Department, University of North Carolina at Chapel Hill.
- Yang, J. Y., Lee, S. H., & Yeo, I. S. (2017). Long and Short-term Volatility Co-movements in the East Asian Stock.Applied Economics and Finance,4(3), 14-29.
Cite this article
-
APA : Hamid, K., Akash, R. S. I., & Ghafoor, M. M. (2019). Testing of Volatility Spillovers Dynamics and Network Connectedness between Islamic Indices of Regional Stock Markets. Global Regional Review, IV(I), 128-137. https://doi.org/10.31703/grr.2019(IV-I).15
-
CHICAGO : Hamid, Kashif, Rana Shahid Imdad Akash, and Muhammad Mudassar Ghafoor. 2019. "Testing of Volatility Spillovers Dynamics and Network Connectedness between Islamic Indices of Regional Stock Markets." Global Regional Review, IV (I): 128-137 doi: 10.31703/grr.2019(IV-I).15
-
HARVARD : HAMID, K., AKASH, R. S. I. & GHAFOOR, M. M. 2019. Testing of Volatility Spillovers Dynamics and Network Connectedness between Islamic Indices of Regional Stock Markets. Global Regional Review, IV, 128-137.
-
MHRA : Hamid, Kashif, Rana Shahid Imdad Akash, and Muhammad Mudassar Ghafoor. 2019. "Testing of Volatility Spillovers Dynamics and Network Connectedness between Islamic Indices of Regional Stock Markets." Global Regional Review, IV: 128-137
-
MLA : Hamid, Kashif, Rana Shahid Imdad Akash, and Muhammad Mudassar Ghafoor. "Testing of Volatility Spillovers Dynamics and Network Connectedness between Islamic Indices of Regional Stock Markets." Global Regional Review, IV.I (2019): 128-137 Print.
-
OXFORD : Hamid, Kashif, Akash, Rana Shahid Imdad, and Ghafoor, Muhammad Mudassar (2019), "Testing of Volatility Spillovers Dynamics and Network Connectedness between Islamic Indices of Regional Stock Markets", Global Regional Review, IV (I), 128-137
-
TURABIAN : Hamid, Kashif, Rana Shahid Imdad Akash, and Muhammad Mudassar Ghafoor. "Testing of Volatility Spillovers Dynamics and Network Connectedness between Islamic Indices of Regional Stock Markets." Global Regional Review IV, no. I (2019): 128-137. https://doi.org/10.31703/grr.2019(IV-I).15